Assemble Chart (AC)
Generate a mixed chart — combining lines, bars, and scatter plots — and display it directly in the InForm interface. This component assembles one or more chart elements into a complete chart layout.
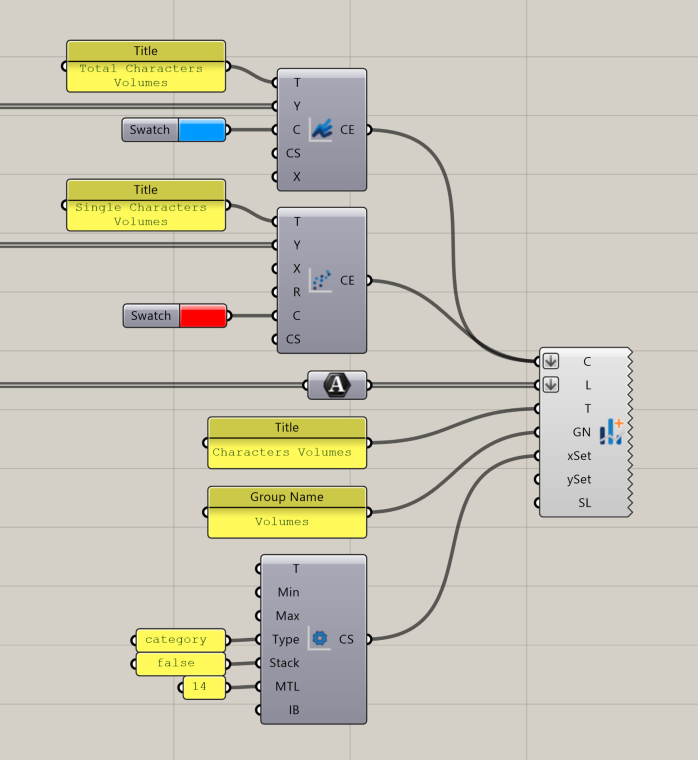
📸 Component Screenshot
📂 Component Location
Tab: 3. Charts
📝 Description
The Assemble Chart (AC) component collects chart elements (lines, bars, or scatter plots), assigns axis labels and settings, applies a title, and controls legend visibility. The resulting chart appears in the InForm sidebar without requiring any downstream connection.
📁 Example File
🔌 Inputs
| Abbrev. | Full Name | Type | Description |
|---|---|---|---|
| CE | Chart Element | InForm Line, Bar, or Scatter component | Chart elements to include in the final mixed chart. |
| L | Labels | Text | X-axis labels. |
| T | Title | Text | Chart title. |
| GN | Group Name | Text | Group identifier used by InForm to organize charts with the same group name. |
| xSet | X Settings | InForm Axis Settings parameter | Configuration for the X axis. |
| ySet | Y Settings | InForm Axis Settings parameter | Configuration for the Y axis. |
| SL | Show Legend | Boolean | Enables or disables the legend display. |
🔄 Outputs
This component has no outputs.
Once all inputs are connected, the chart is directly rendered inside the InForm platform.